Every time I see people eating in a New York restaurant with a big orange “C” on the window I wonder: why is anyone eating there? Maybe those people were on their phones as they walked in. Or they’ve never seen Kitchen Nightmares.
I’m planning to travel to Austin, and when I found out that all of their food inspection data is available, I wanted to see how the city’s restaurants compared. Here they all are by their minimum inspection score, from 2015-2017. I’ve also included their most recent score, and, since food sanitation is a continuous commitment, their average score.

If you’re curious about a street or neighboorhood in the graph above, try zooming and panning. And if you’re walking around downtown, take a quick look before walking into, say, the crawfish shack - or you may not walk out.
Additional Thoughts
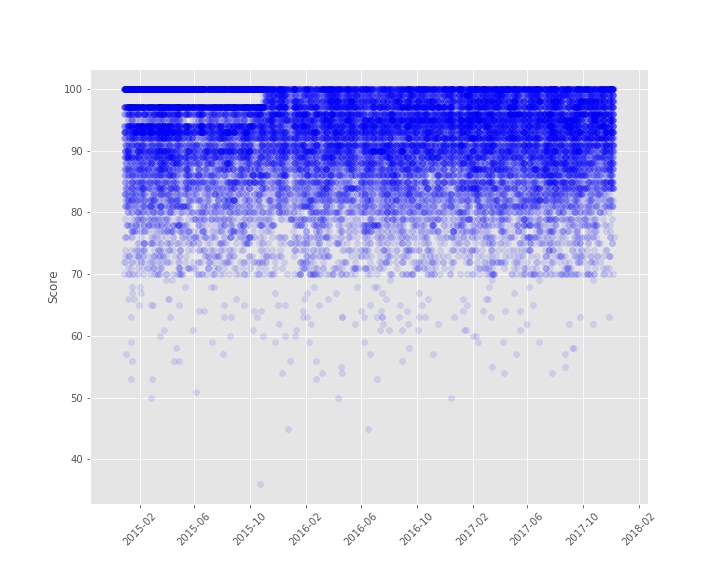
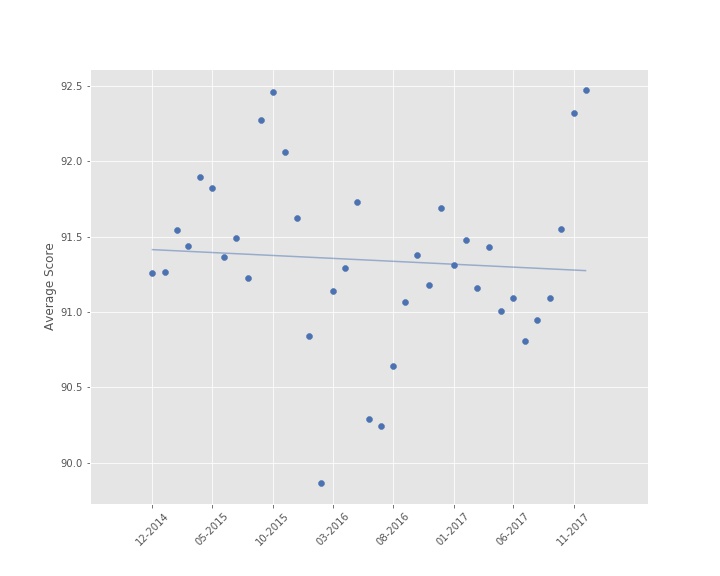
Looking at the city’s scores over time, there’s not much change at the overall level.

Mean citywide scores fluctuate only slightly, with an insignificant regression coefficient (p = 0.670).
